
Screenshots
Here, we show some images of the different parts of p3d in operation; click on the thumbnails to see a larger version of each image. Select among the following four categories:
Main control panel of p3d


![The p3d main panel GUI - Mitchell Spectrograph [VIRUS-P]/bundle 2](p3d_mGUI_VIRUSb2.png)
Return to the top.
Tracing
Will be updated
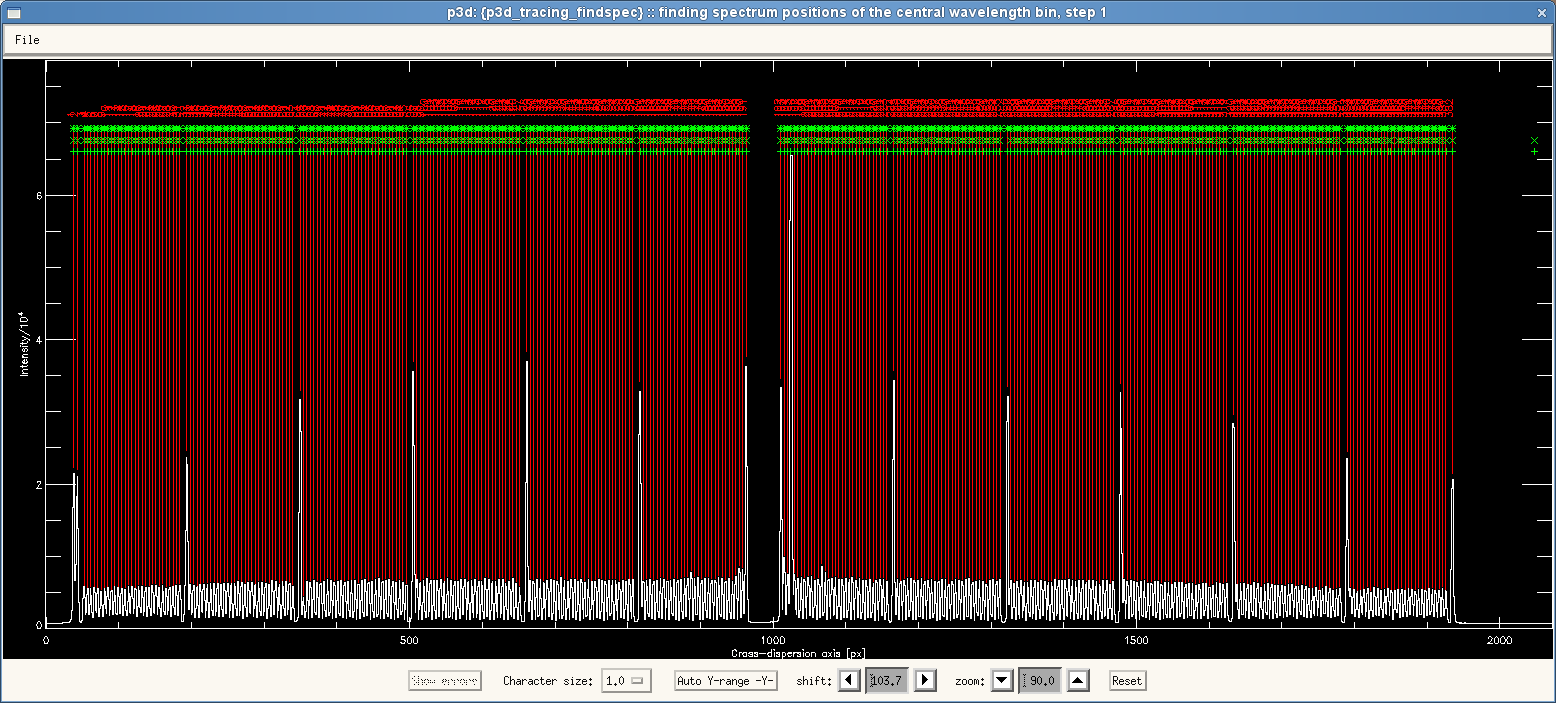
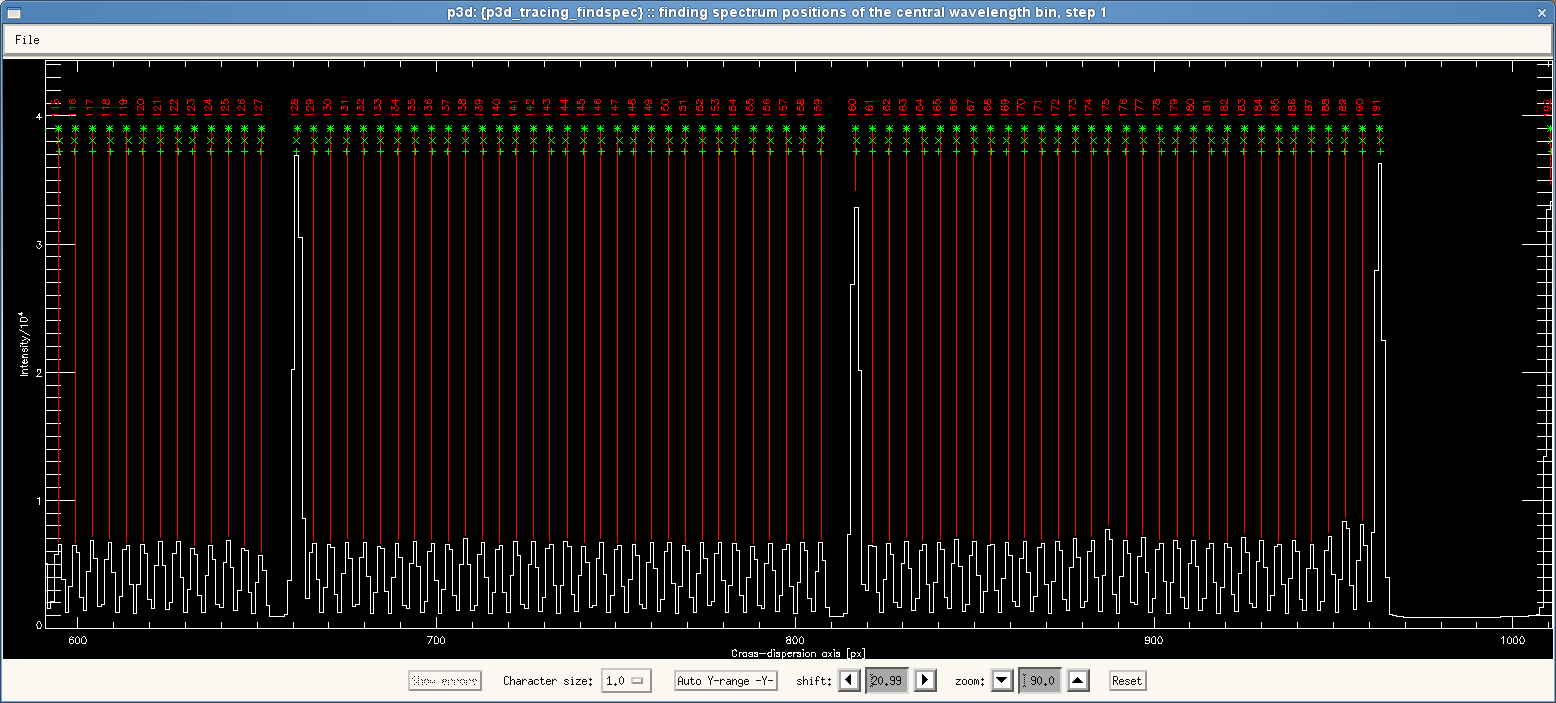
These two screenshots show the GUI that pops up when spectrum positions have been located in the first step of the tracing procedure. Using this tool one can check if p3d has found all spectra. These plot were made using data of the PMAS/PPAK/2kx4k-CCD instrument; the first screenshot shows all spectra and the second screenshot a zoom.
Return to the top.
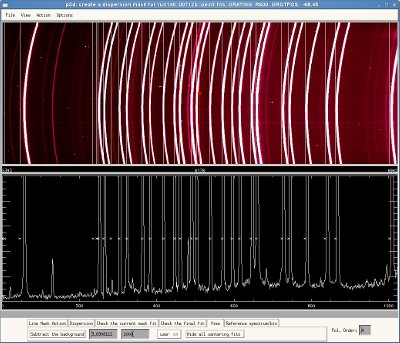
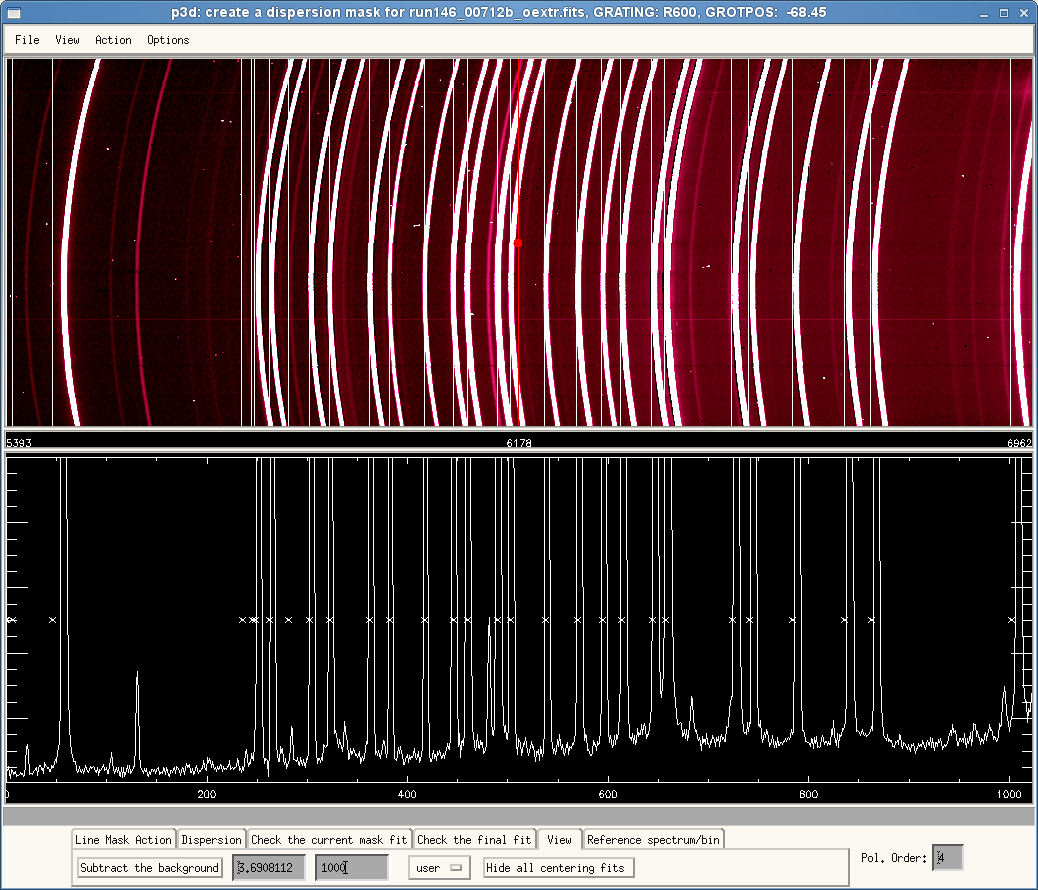
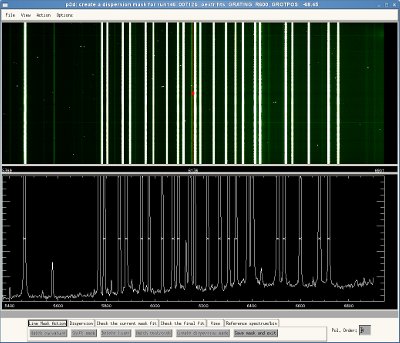
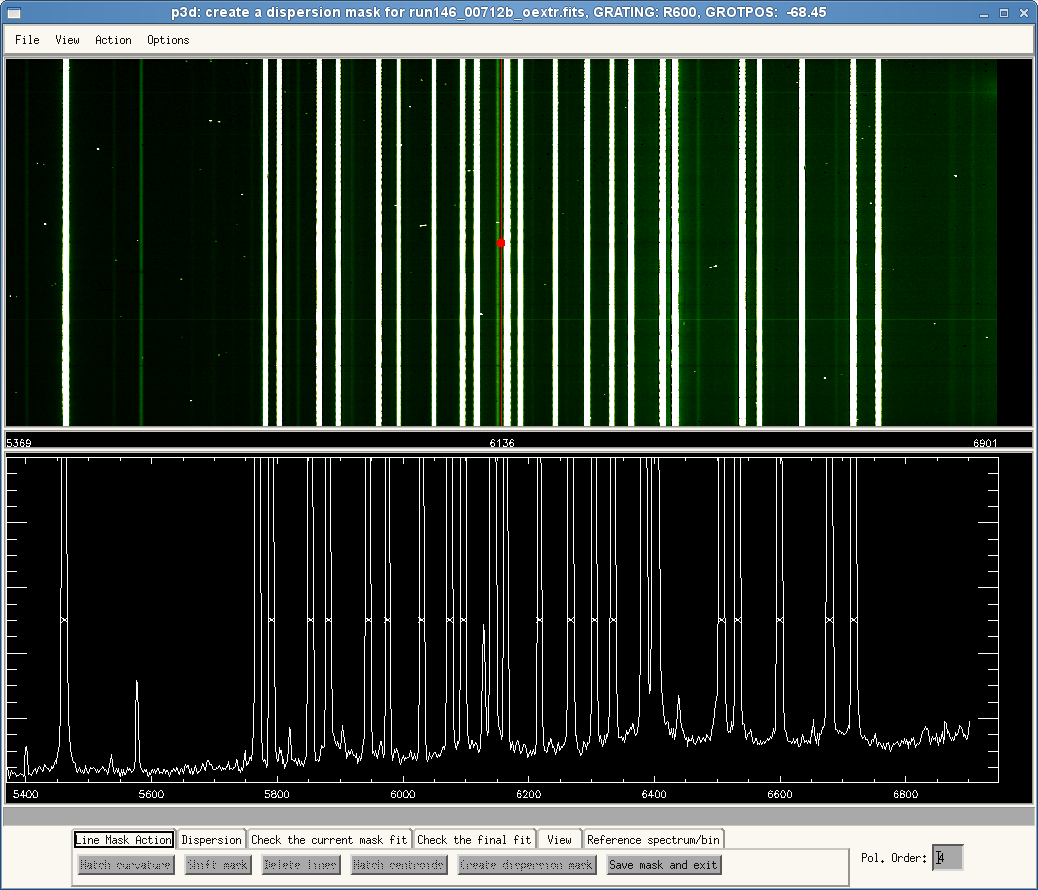
Dispersion mask creation
Will be updated
These two screenshots show the dispersion mask creation GUI before (first plot) and after (second plot) a dispersion solution has been created. Each row in the upper image represents the spectrum of one spatial element. A reference spectrum is shown in the lower row (indicated with a red disk in the upper image). These plot were made using data of the PMAS/PPAK/2kx4k-CCD instrument.
Return to the top.
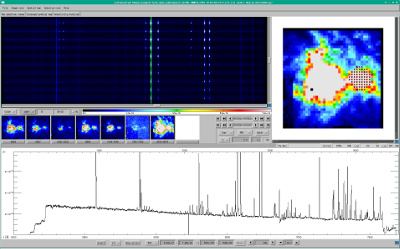
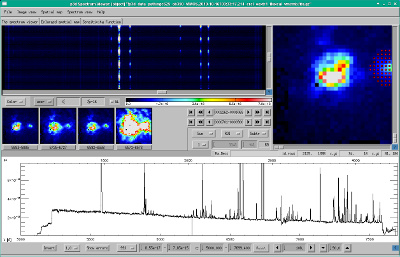
Spectrum Viewer
These two screenshots show the spectrum viewer of p3d using VIMOS data; the first image uses most space of an HD screen (1920×1200 px²) and the lower image is smaller.
Back to the top.
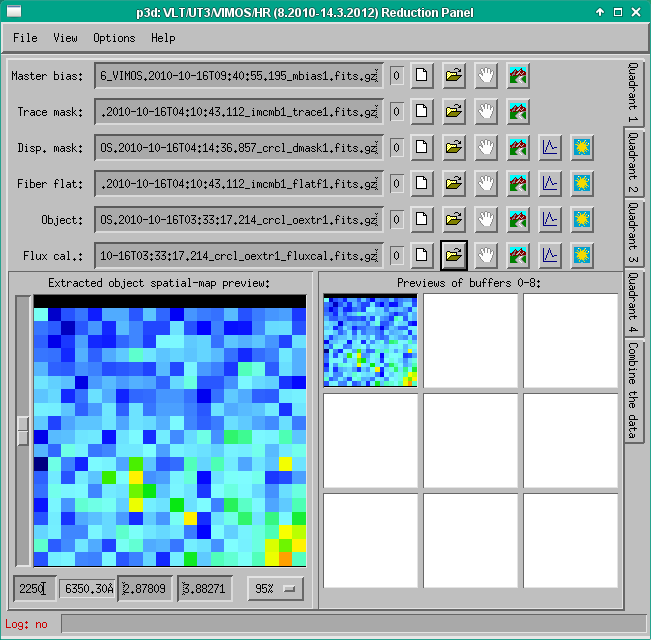
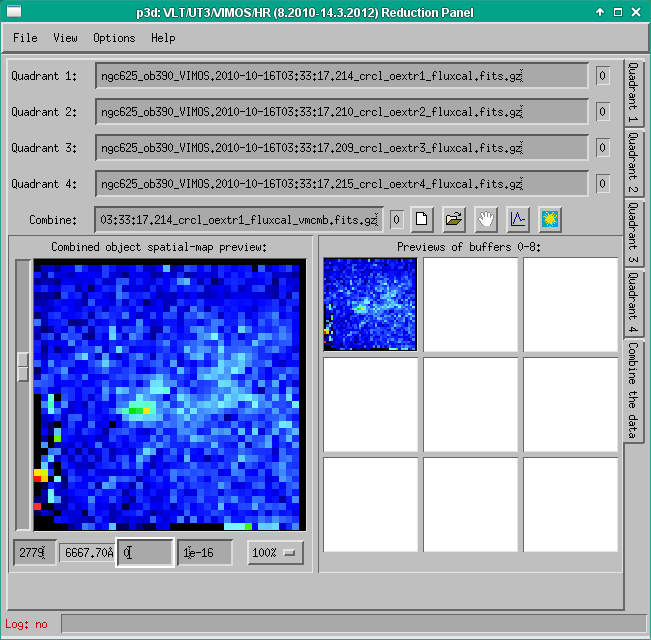
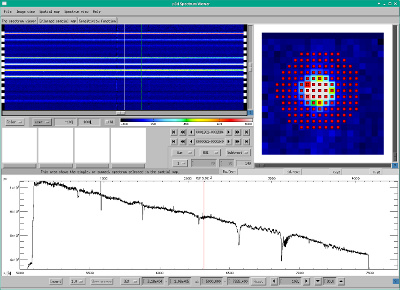
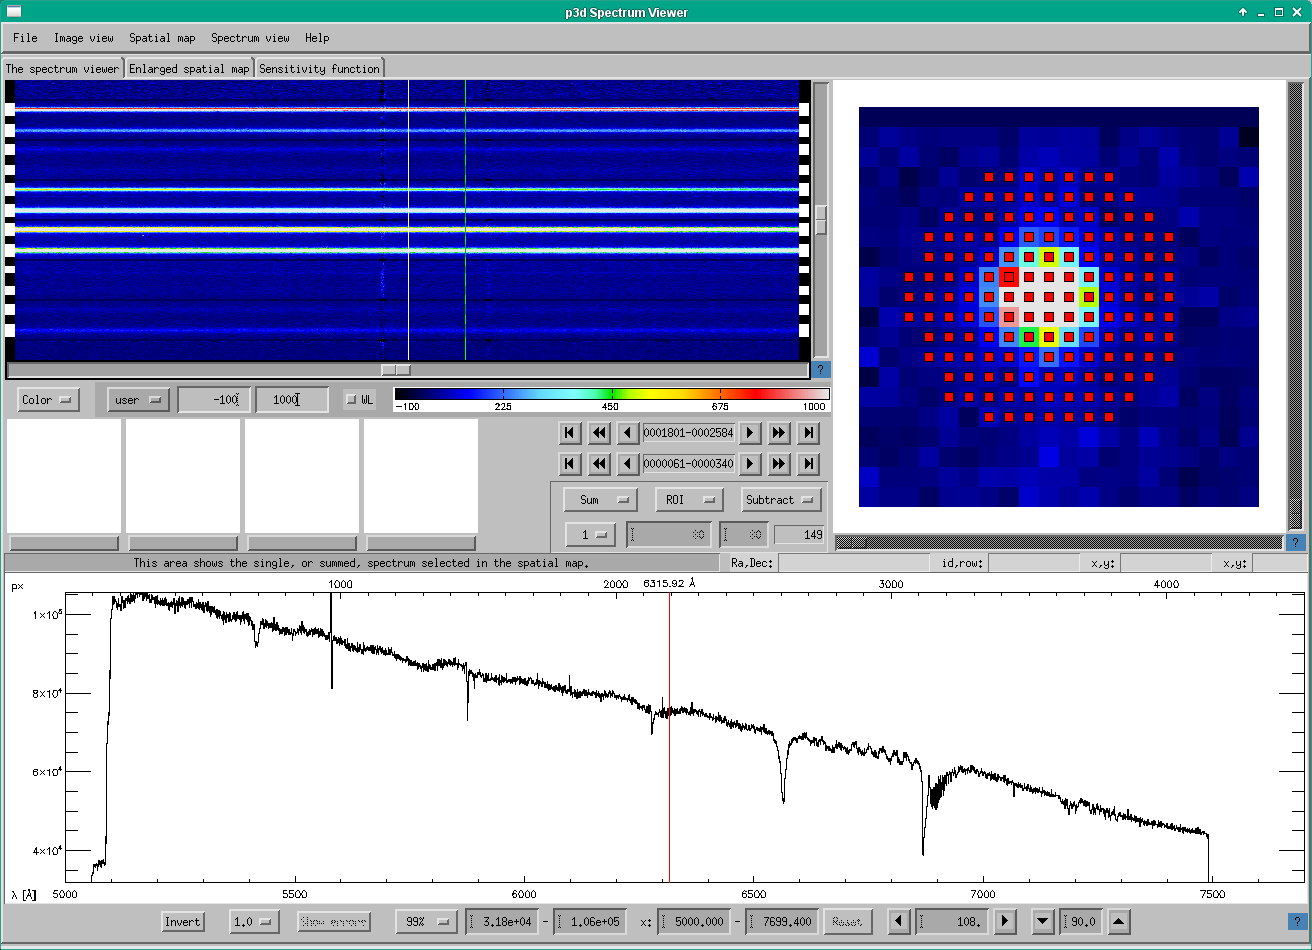
The following images show the spectrum viewer of p3d using VIMOS data of a standard star. The three screenshots show the main panel, the enlarged spatial-map panel, and the sensitivity-function panel, respectively.
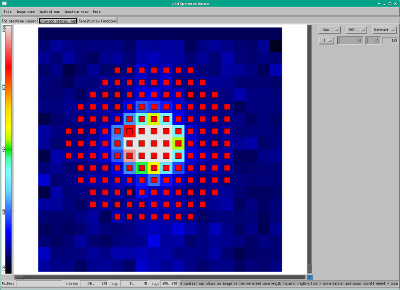
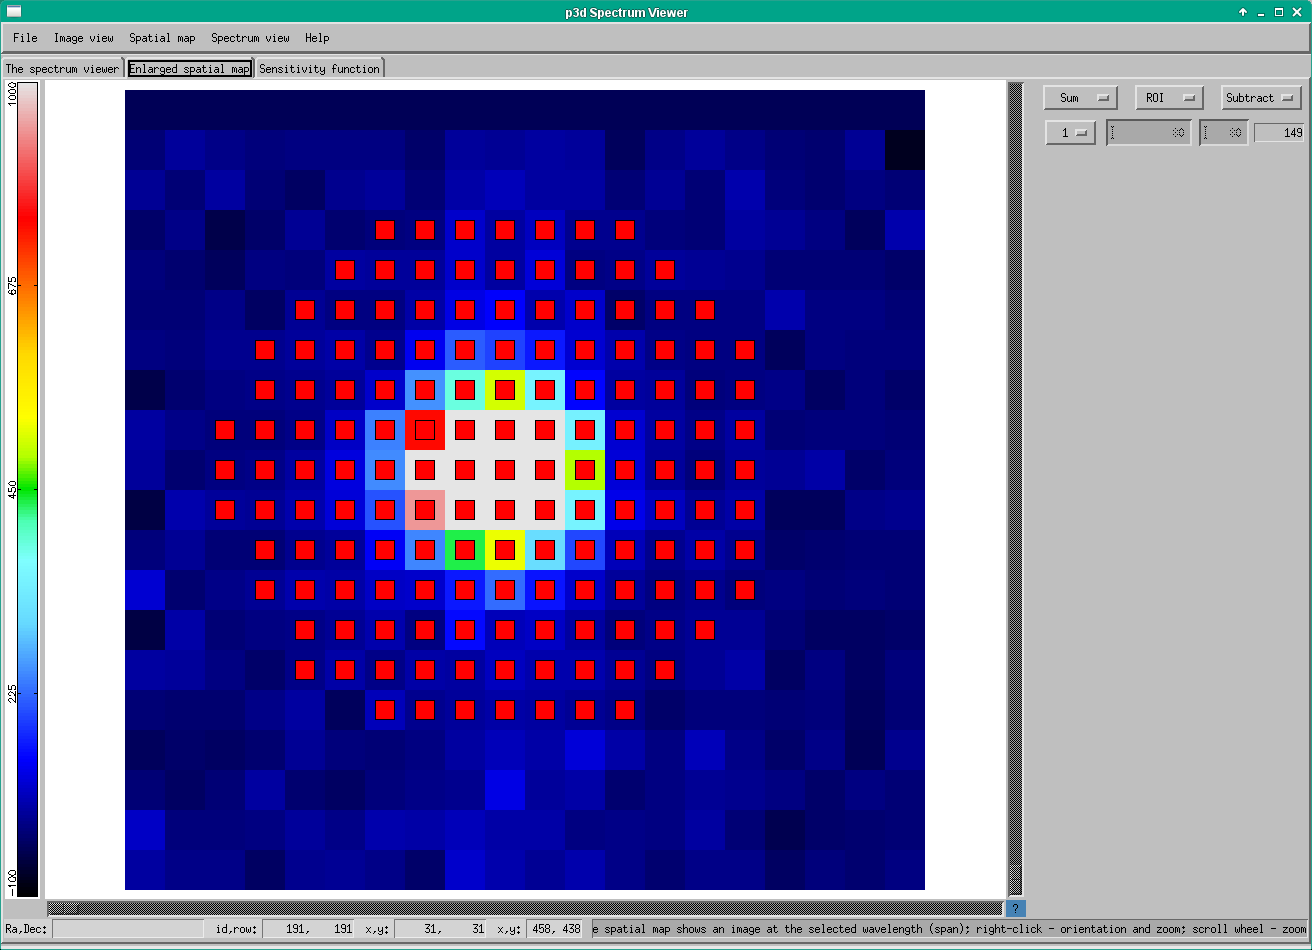
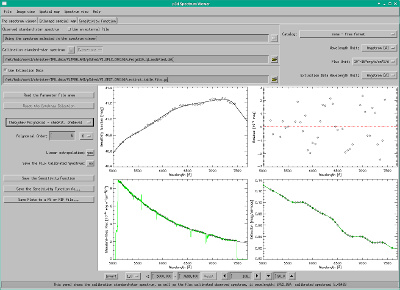
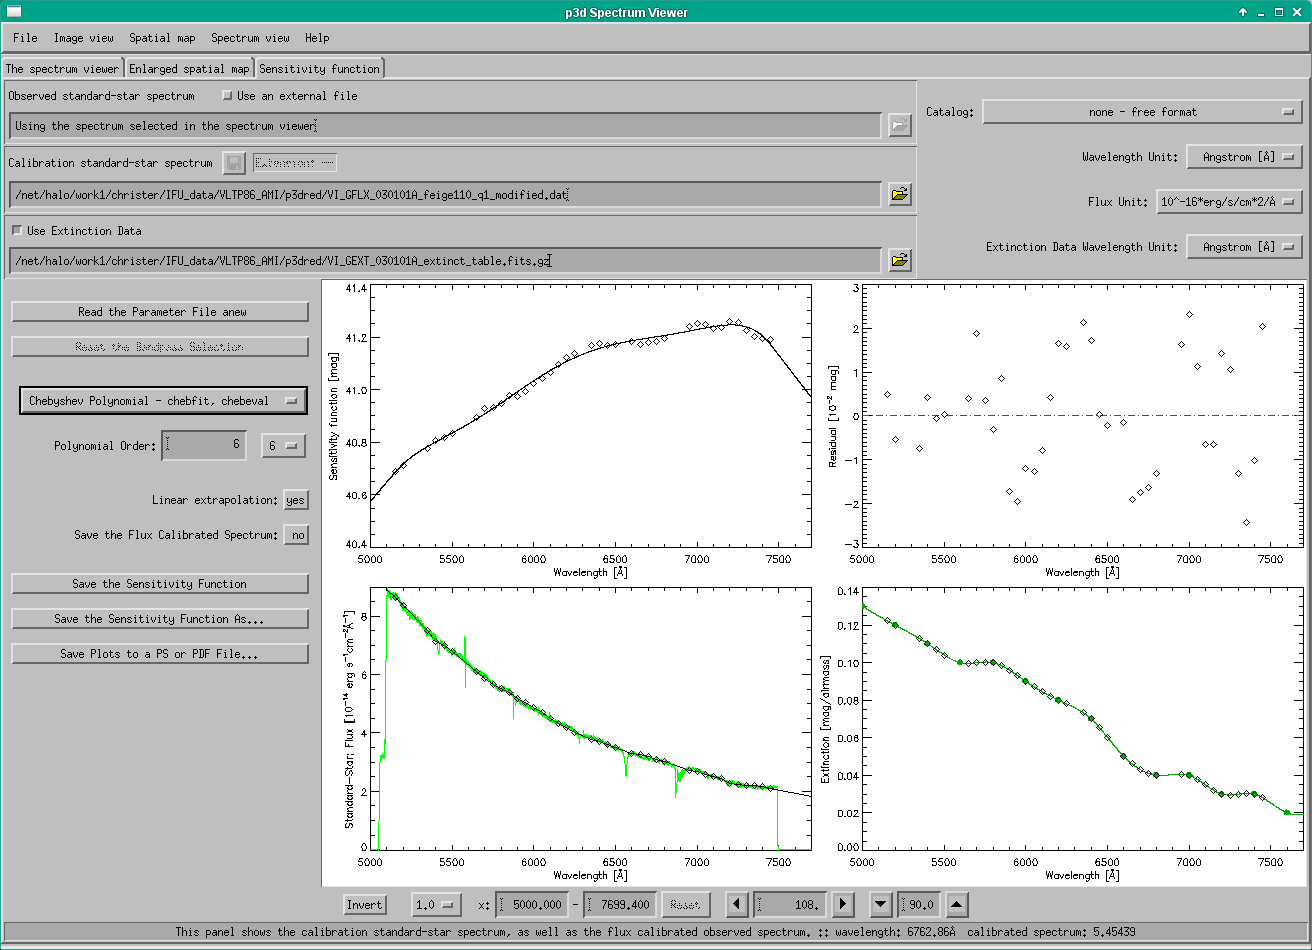
Return to the top.
These two screenshots show the spectrum viewer of p3d using MUSE data; this is how the spectrum viewer appears on a 2560×1600 px² 30" screen.
Return to the top.
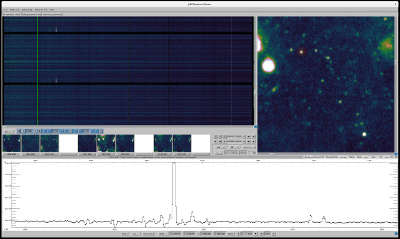
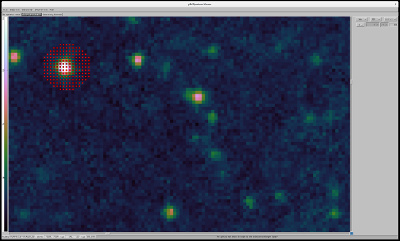
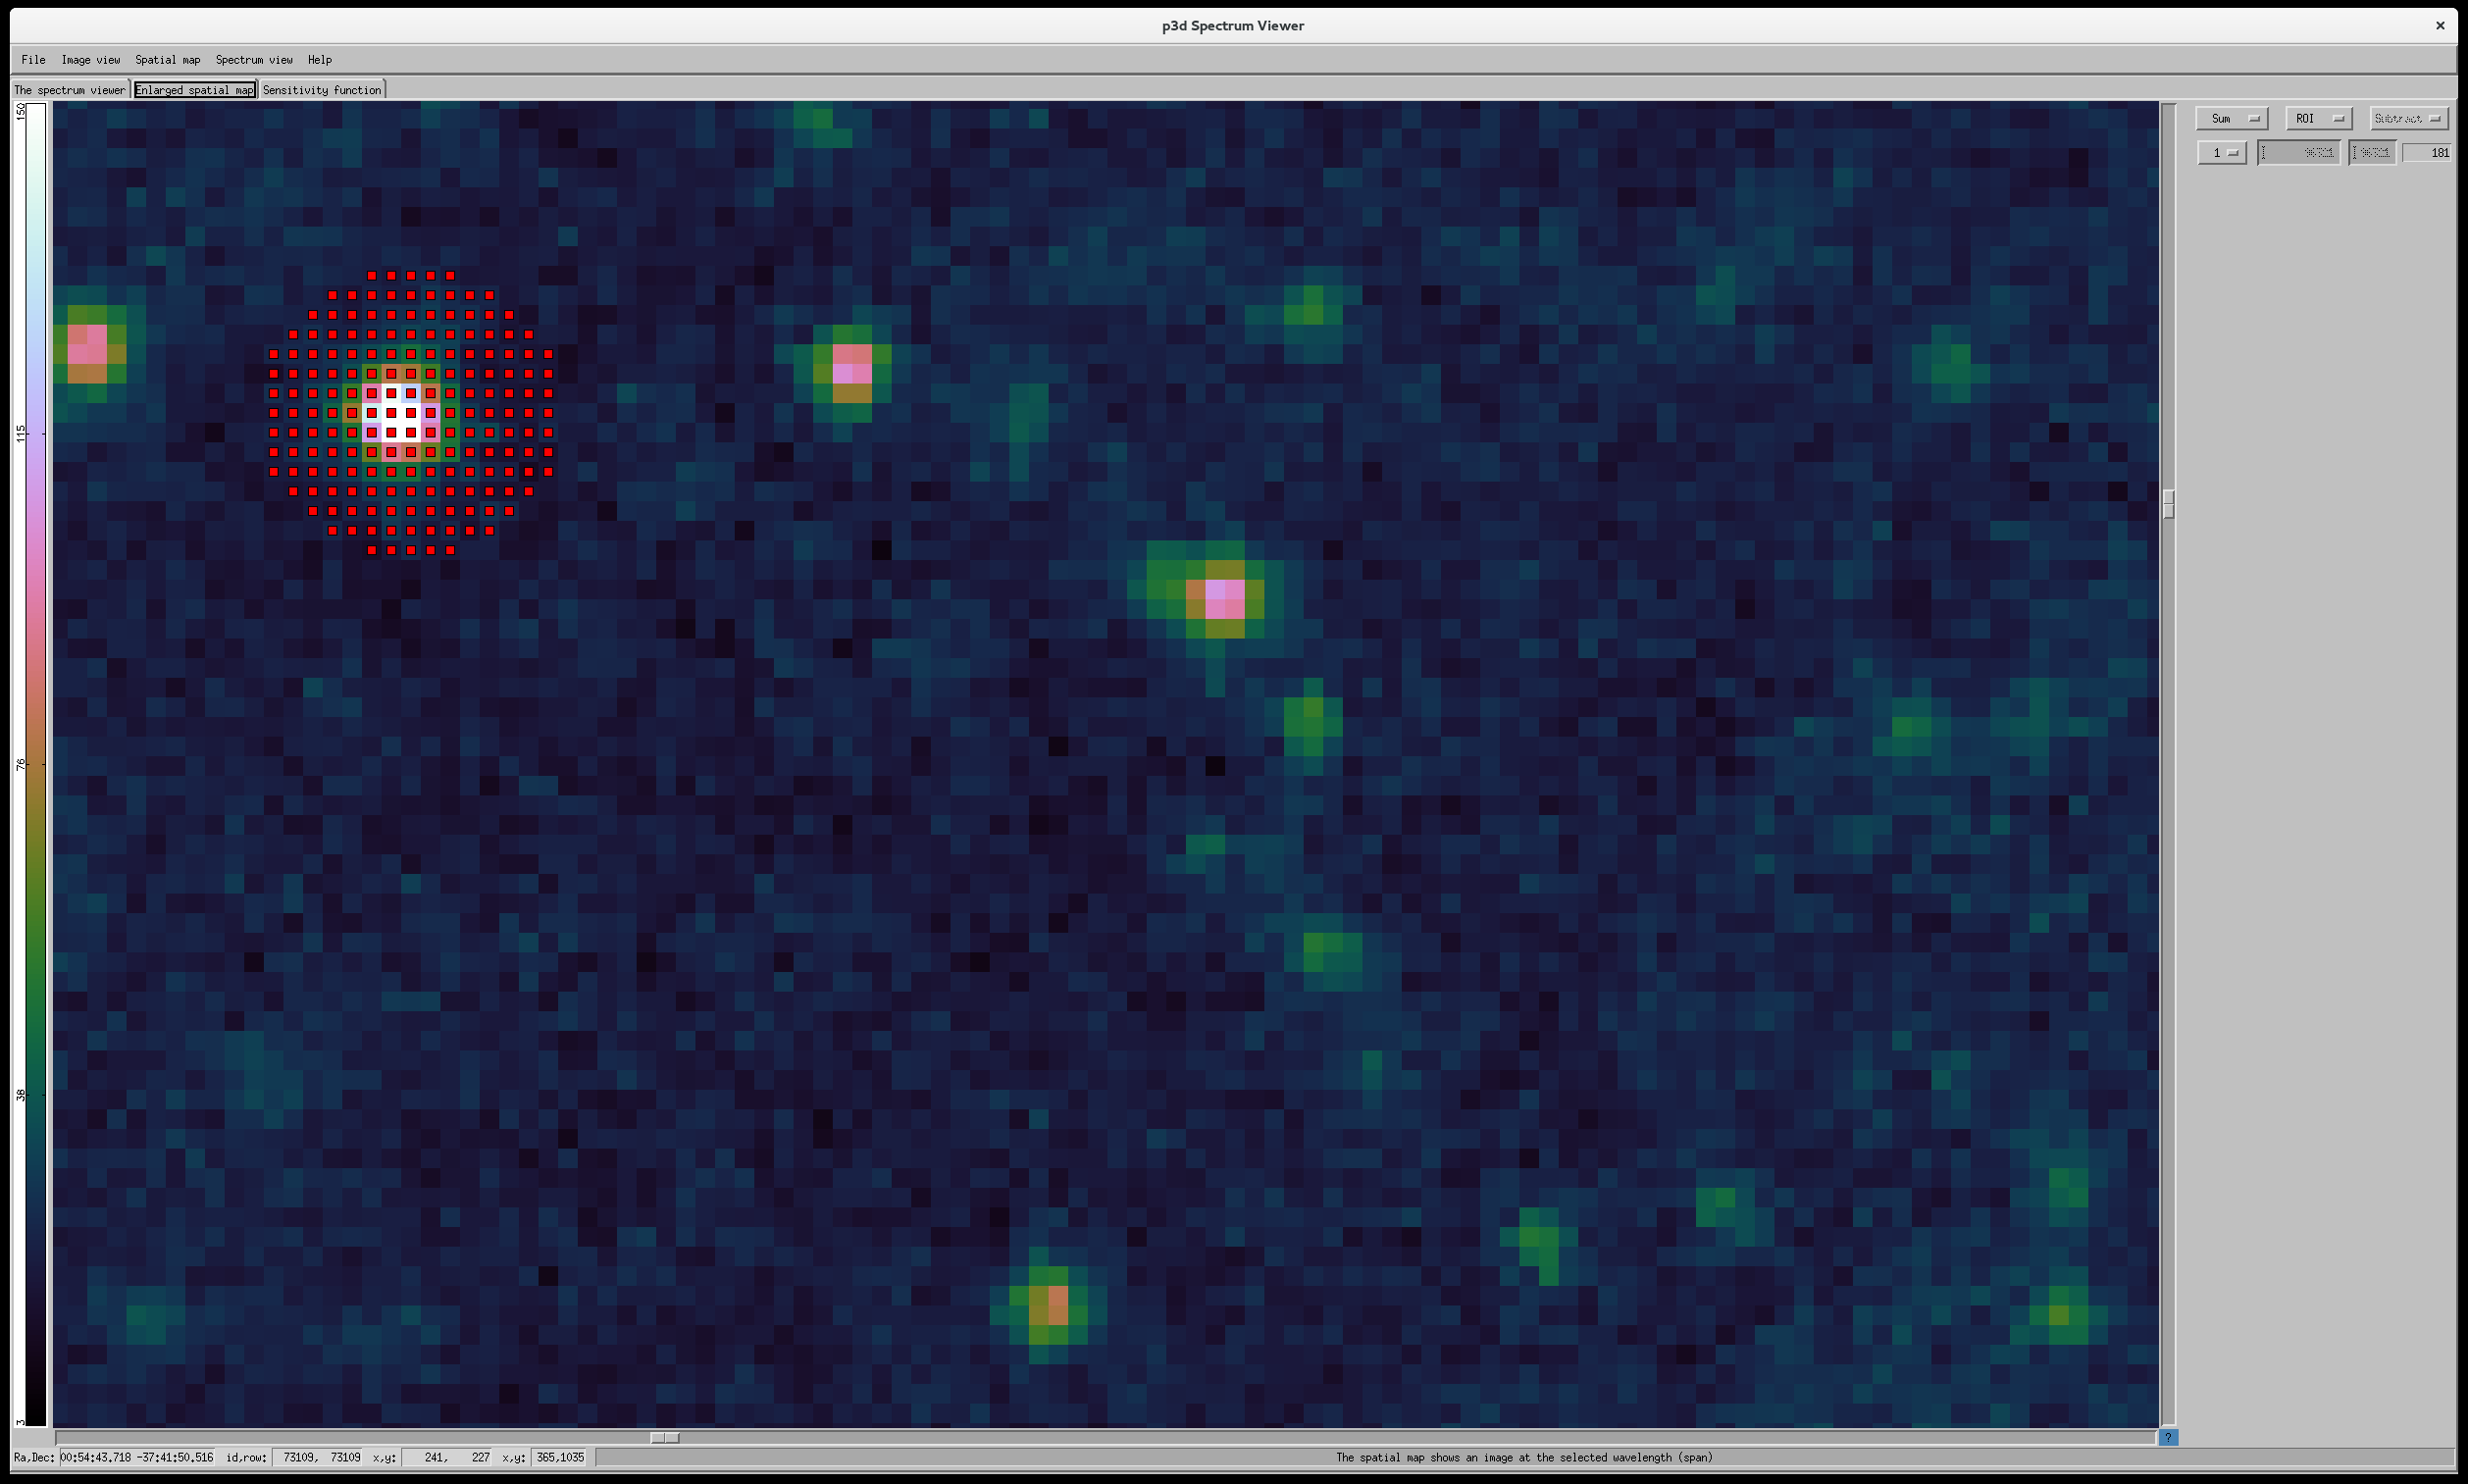
The following four screenshots show the spectrum viewer of p3d using the publicly available MUSE data of M42.

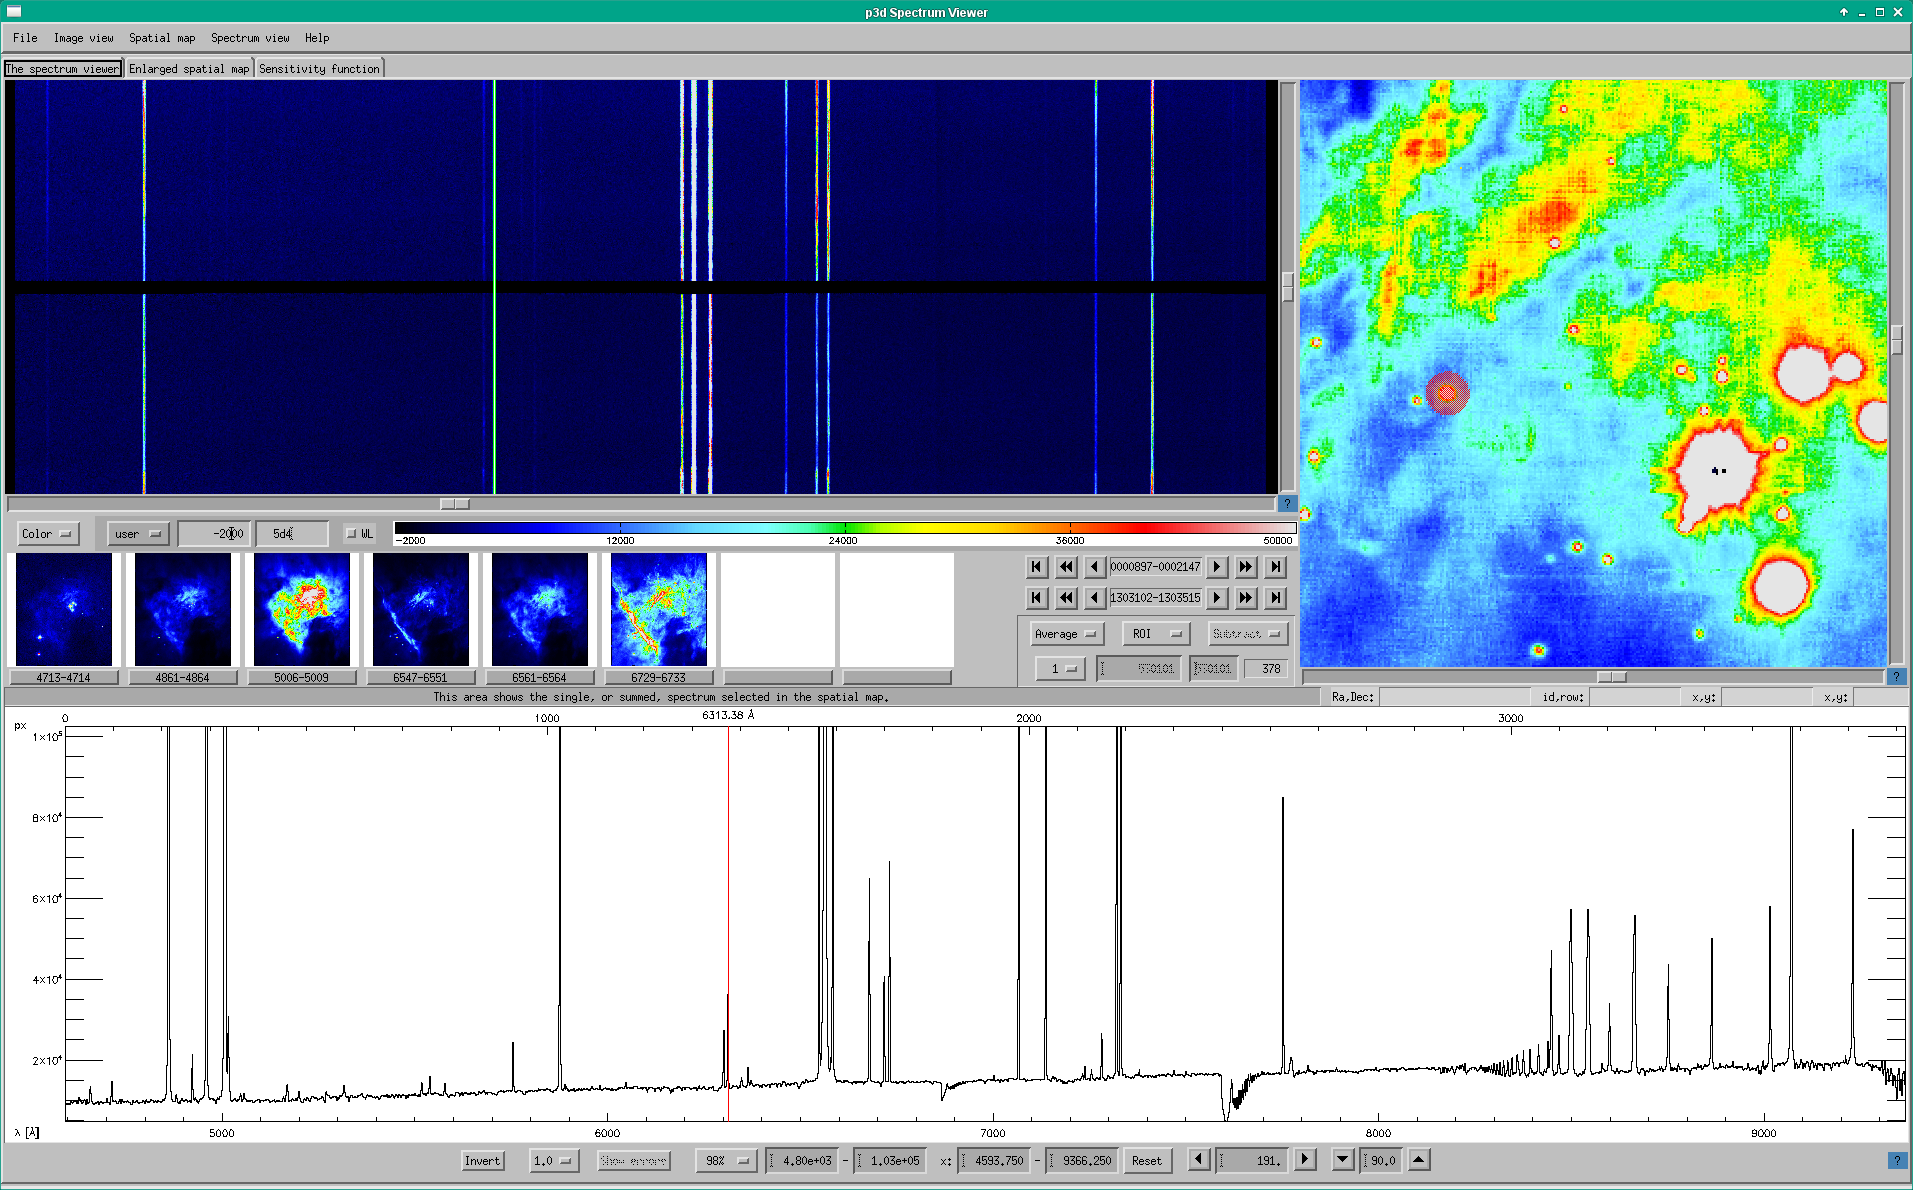
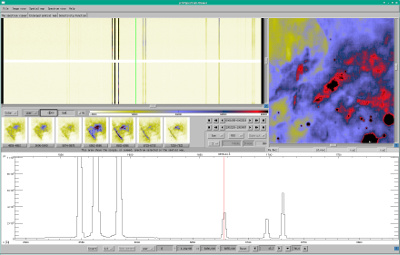
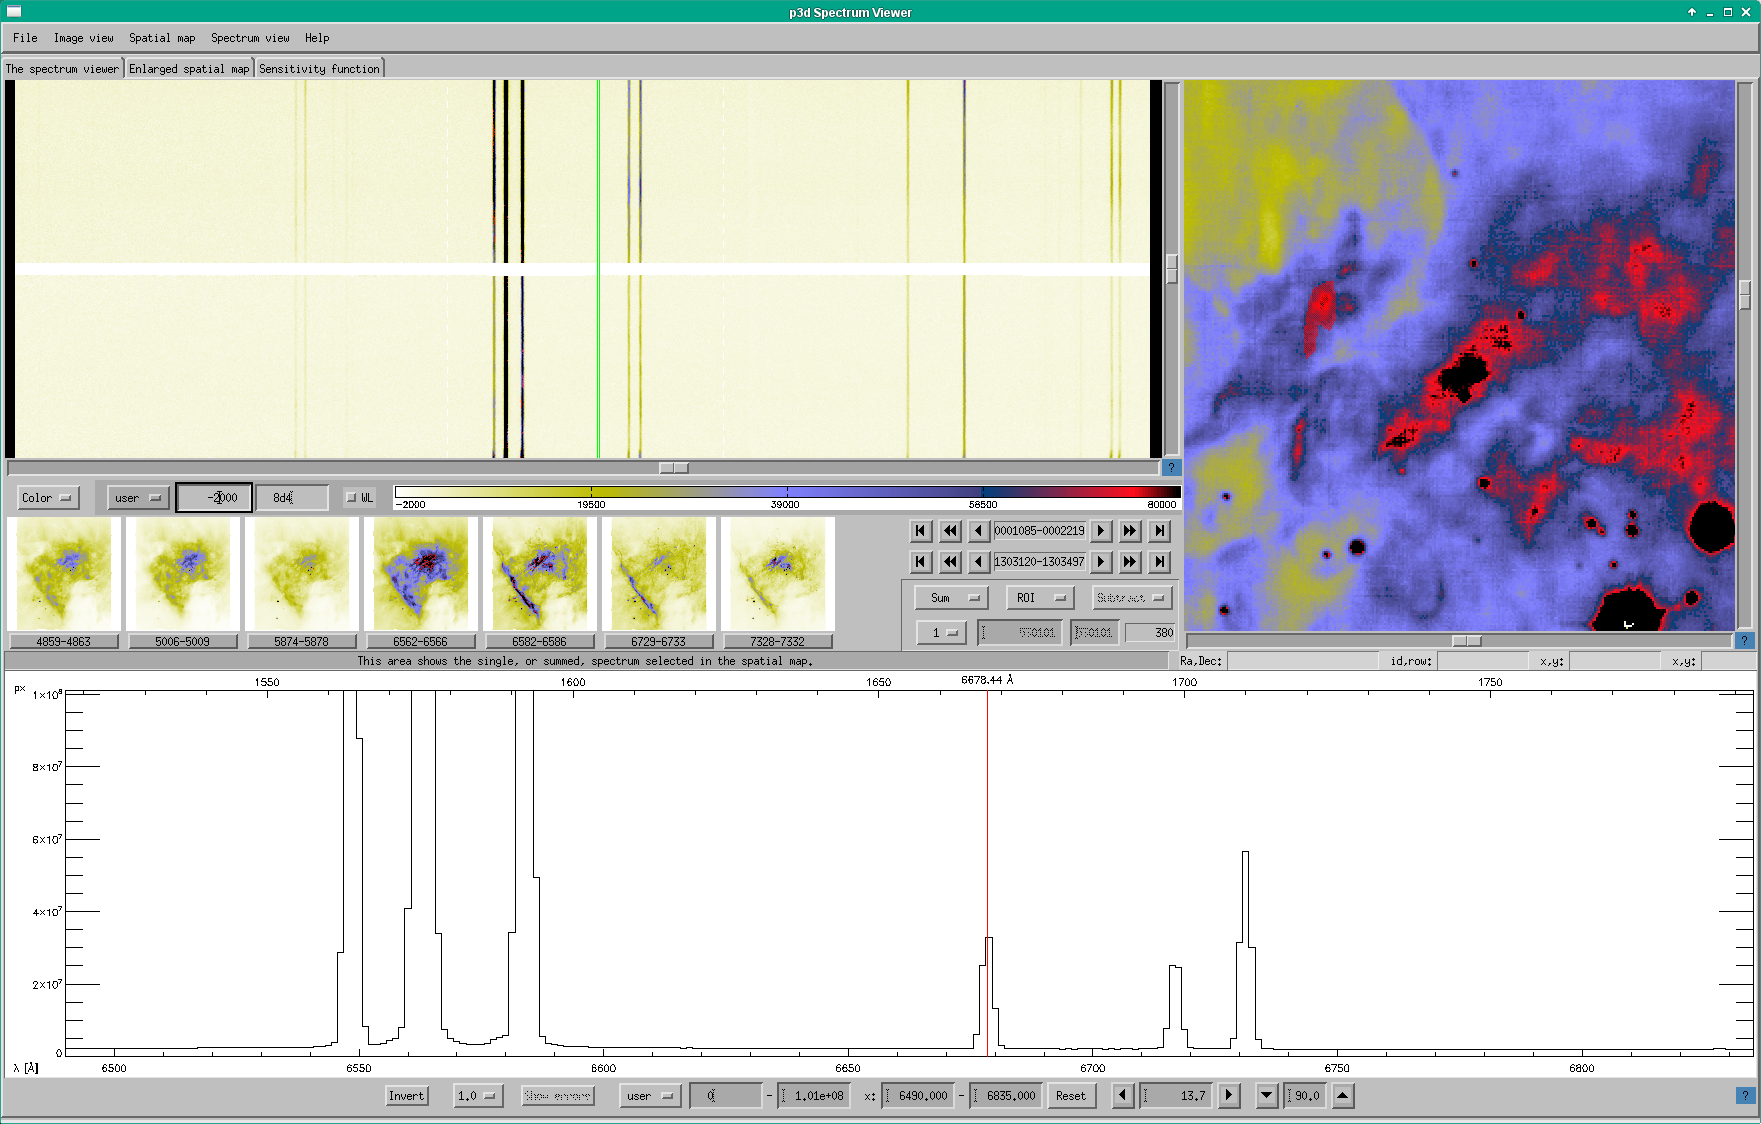
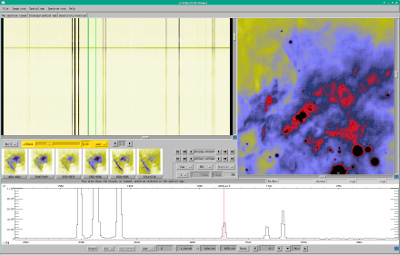
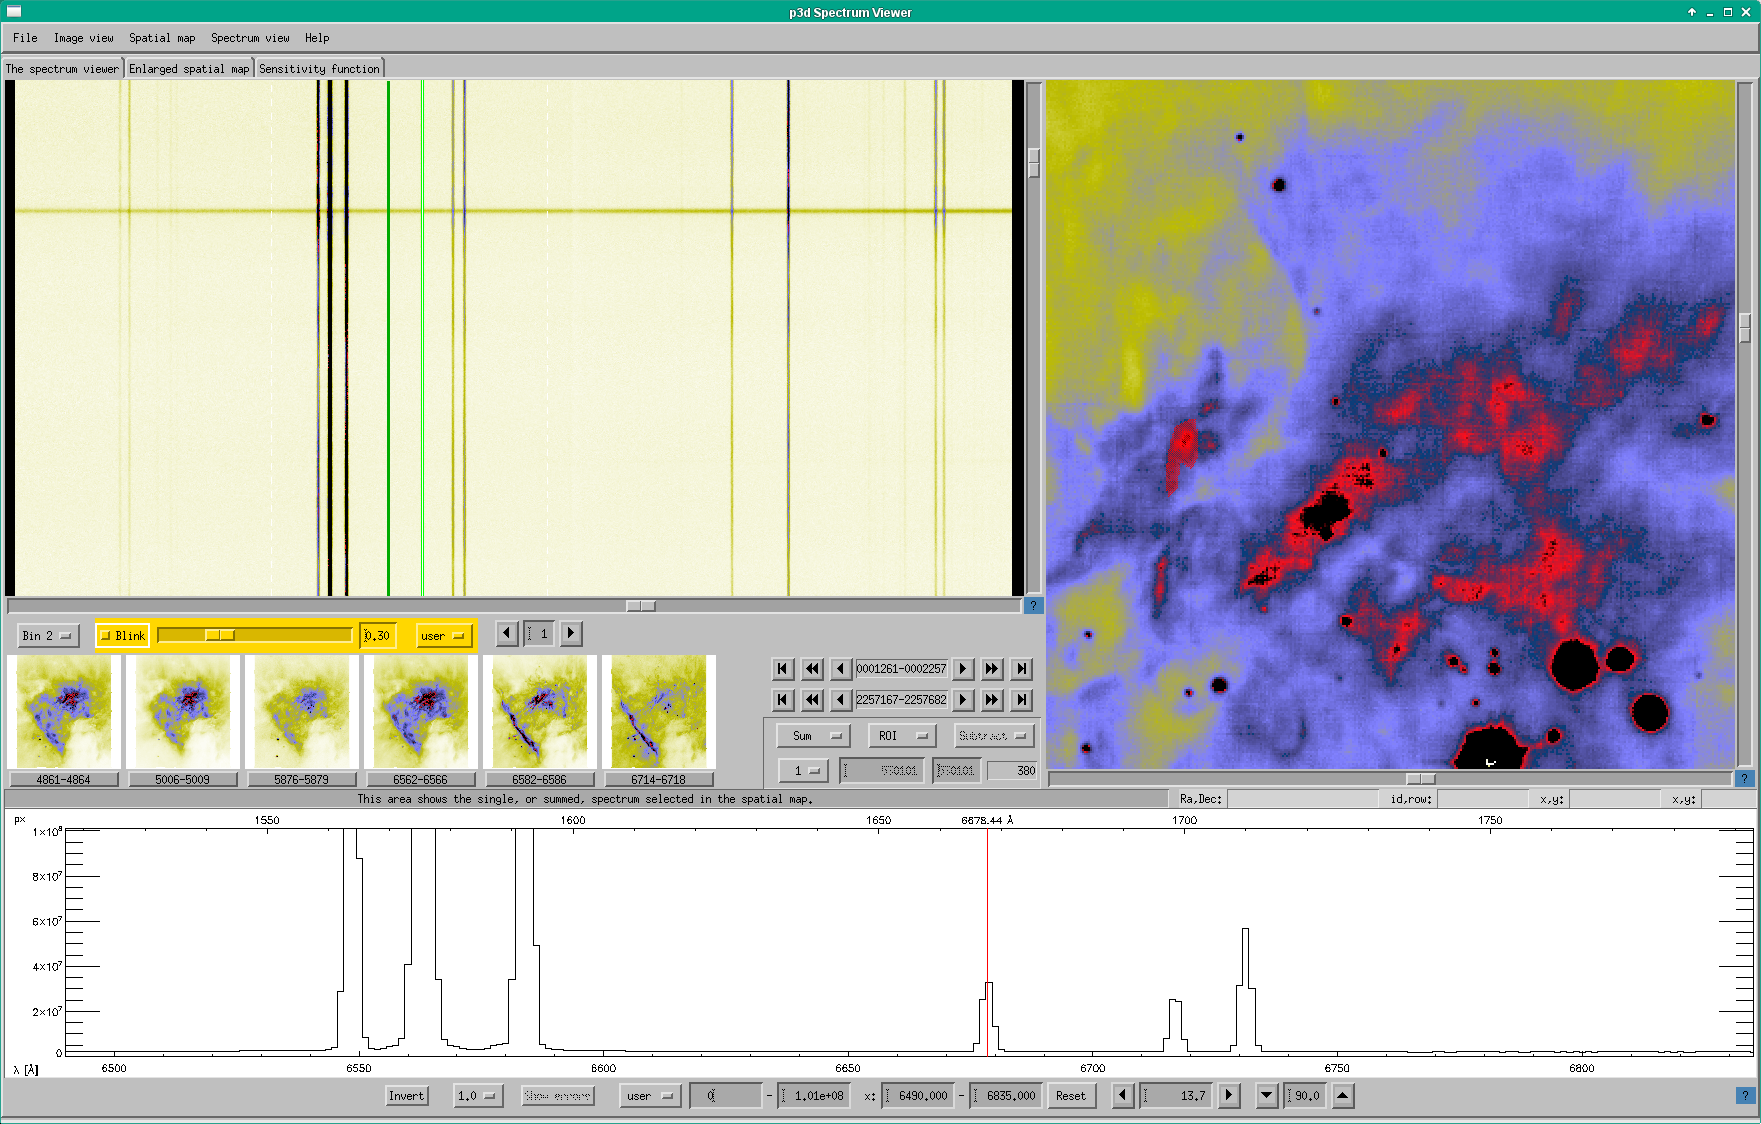
Viewing these 75–110 GiB data cubes is as easy as entering the following on the command line:
p3d_sv_vm.sh --noqueue DATACUBEFINALuser_20140216T010259_cf767044.fits.
To save on RAM and be a bit more informative, one could instead use:
p3d_sv_vm.sh --noqueue DATACUBEFINALuser_20140216T010259_cf767044.fits /noerrors /verbose colortable=-4.
The data cube(s) can be downloaded here.
Note! The machine used to view the cubes needs at least as much RAM as the CUBE is big (or half that when the error data are not loaded).
Return to the top.
Will be updated
This screenshot shows the spectrum viewer of p3d, using the Mitchell Spectrograph [VIRUS-P]/bundle 2.
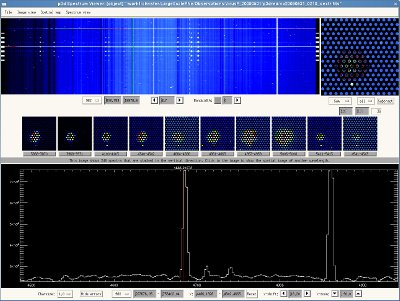
Return to the top.
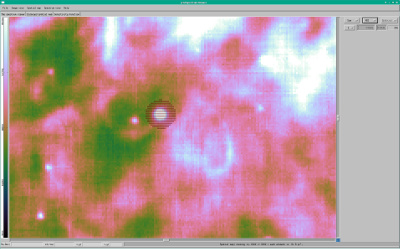
Image Viewer
This screenshot shows the image viewer of p3d, illustrating data of PMAS/LARR/4k×4k-CCD. For this CCD four different fields are read out separately, and are then combined by p3d. Each horizontal line is a spectrum, the red overplotted lines indicate the positions of the spectra.
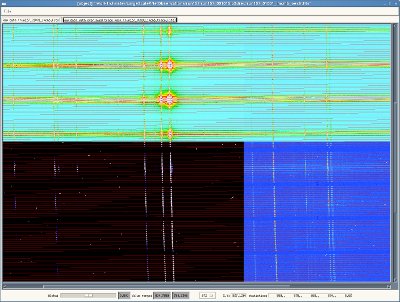
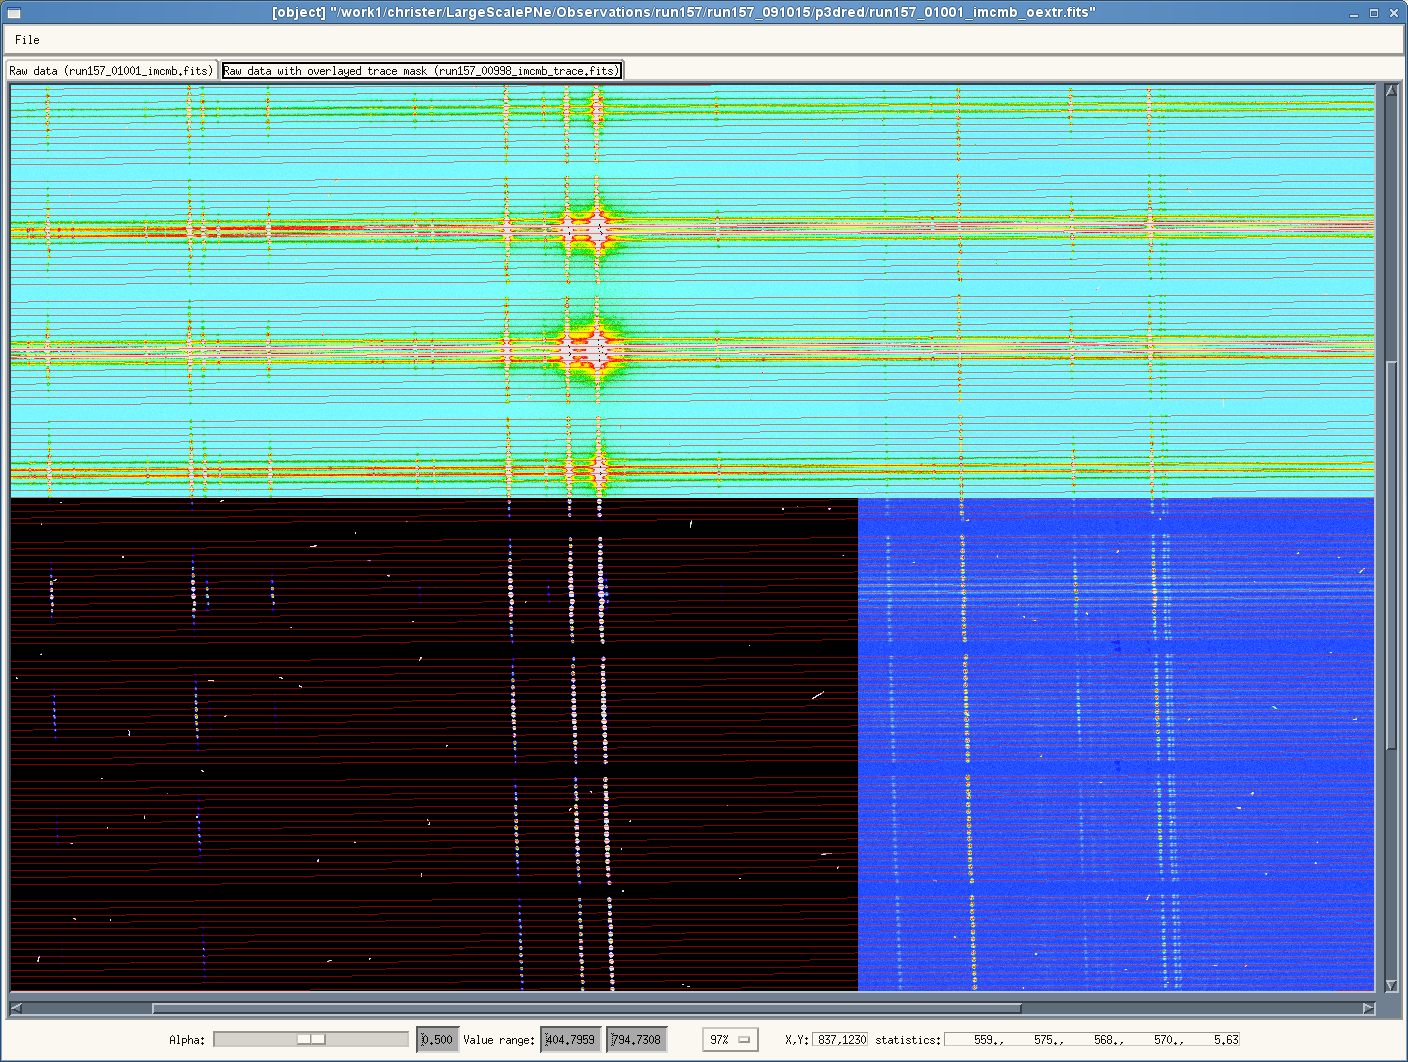
Return to the top.